
CPU Temperature Monitor:
Why Server Heat Needs More Than a Basic Utility
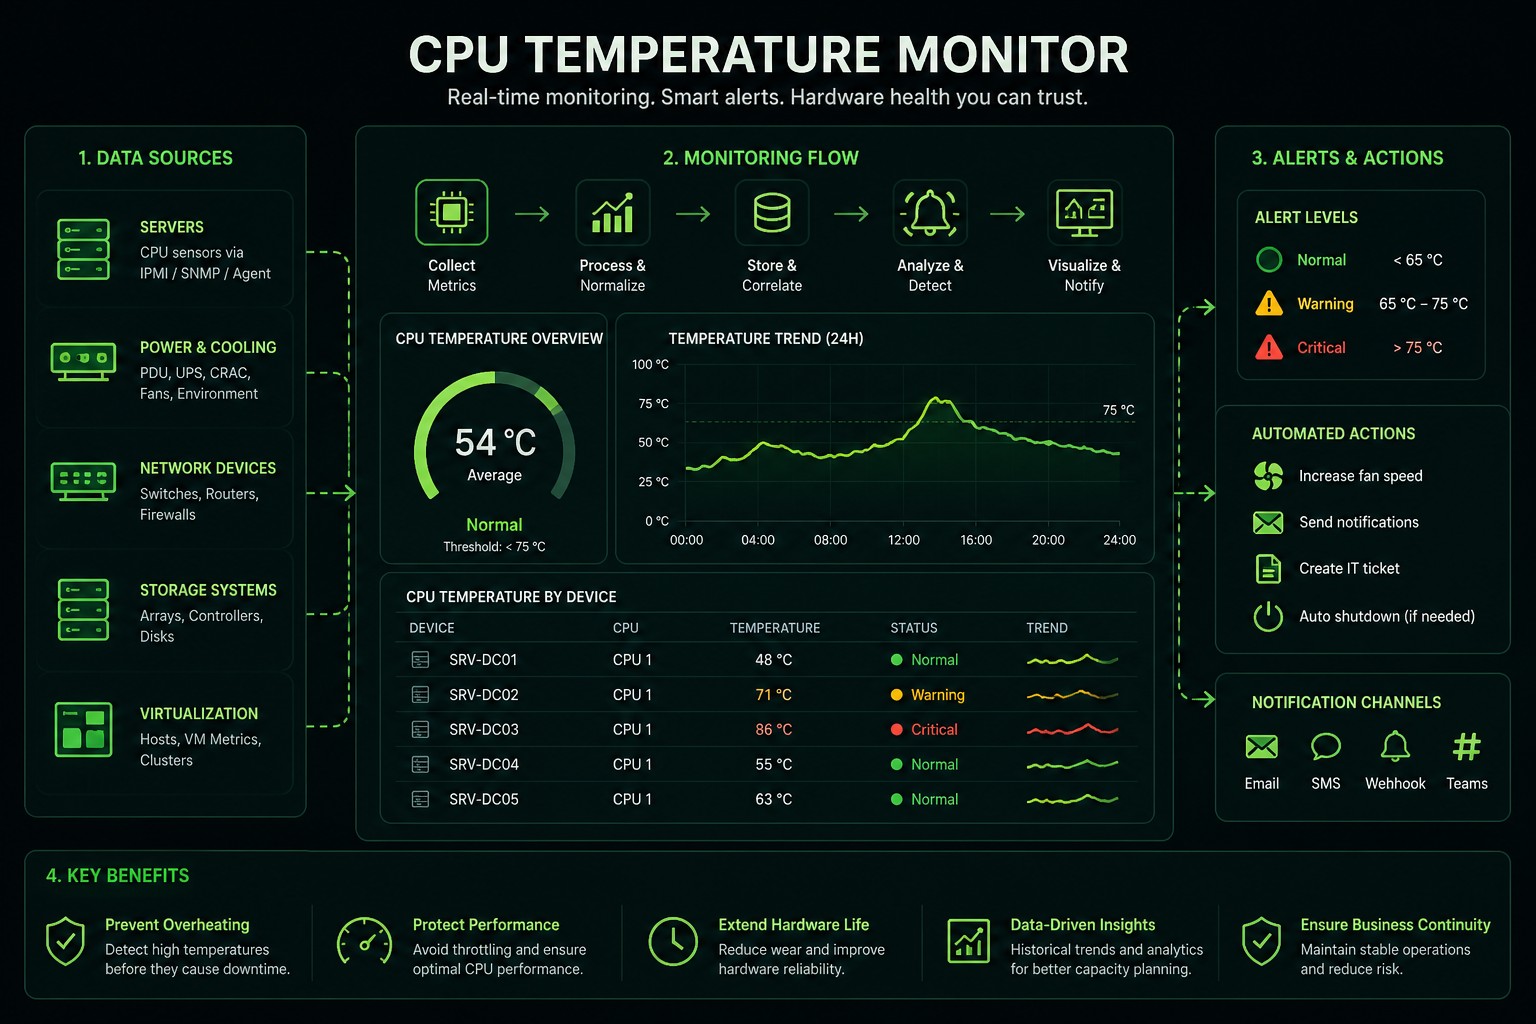
A CPU temperature monitor helps IT teams track processor heat before it turns into throttling, shutdowns, hardware damage, or unexpected downtime. For a personal computer, a lightweight tool may be enough. In an enterprise data center, CPU temperature monitoring needs to connect with hardware health, fan status, power supply condition, rack-level heat, alerting, asset data, and business service impact.
Sensaka is built for this larger problem: monitoring infrastructure from hardware to business service, using deep multi-vendor hardware visibility and out-of-band monitoring to help teams find risks earlier and respond faster.
CPU Temperature Monitoring Explained
What Is a CPU Temperature Monitor?
A CPU temperature monitor is software that reads processor temperature data and helps users understand whether a CPU is running within a safe range. Basic tools usually show current CPU temperature, fan speed, voltage, load, clock speed, and similar hardware sensor data.
Tools like Open Hardware Monitor can read Intel and AMD CPU core temperature sensors and display fan speeds, voltages, load, and clock speeds. HWMonitor follows a similar utility-style model, reading PC health sensors such as voltages, temperatures, powers, currents, fan speeds, utilizations, and clock speeds. These tools are useful for desktops, workstations, labs, and troubleshooting individual machines.
For enterprise IT, the problem is wider. A CPU temperature spike is rarely just a number. It can signal airflow problems, overloaded workloads, failing fans, blocked cooling paths, firmware issues, rack density problems, or a developing hardware fault.
Why CPU Temperature Monitoring Matters
Excessive CPU temperature can reduce CPU clock rate, force devices to shut down, shorten device lifespan, and damage components such as the motherboard or chip transistors. Continuous monitoring across the network helps prevent overheating from slowing down or shutting down critical services.
In a data center, this becomes a service availability issue
A single overheated server may affect virtual machines, databases, applications, storage paths, or customer-facing services. The operational question is not only "What is the CPU temperature?"
The better question is: which service is at risk, which hardware component is causing it, and what action should the operations team take?
Where Basic CPU Temperature Monitors Fall Short
OS dependency
Many tools depend on the operating system. If the OS is down, frozen, or unreachable, the monitoring view can disappear exactly when the team needs it most.
Single-vendor focus
Many basic tools are not built for multi-vendor enterprise estates. Large data centers run Dell, HP, Cisco, Huawei, and more: all in the same rack.
Temperature data without context
A CPU temperature alert needs context: fan speed, power supply, rack location, workload, service dependency, historical trend, and related alarms.
Manual inspection at scale
Large equipment volume, tedious manual inspection, isolated resource data, unknown real-time equipment temperature, and local hot spots cannot be handled manually.
How Sensaka Approaches CPU Temperature Monitoring
Sensaka treats CPU temperature as one part of infrastructure health. The platform is designed for full-stack visibility from hardware to business service: servers, storage, network devices, power environment, virtualization, operating systems, databases, middleware, applications, and business systems. Fine-grained monitoring, precise detection, fault localization, and fault warning across brands such as Dell, HP, IBM, Cisco, Inspur, Huawei, Lenovo, Nutanix, and Fujitsu.
| Layer | What Sensaka Can Monitor |
|---|---|
| CPU and server components | CPU, memory, fan, power supply, array card, PCIe card, network port, hardware logs |
| Rack and room environment | Temperature, humidity, power, UPS, precision air conditioning, PDU |
| Storage and network | Controllers, ports, cache, disk, traffic, packet loss, optical port status |
| Virtualization and cloud | Hosts, VMs, clusters, CPU usage, memory usage |
| Business service | Application availability, service health, dependency mapping |
Why Out-of-Band Monitoring Matters for CPU Temperature
Traditional in-band monitoring relies on agents, operating system services, or production networks. Out-of-band monitoring uses a dedicated management network connected to server BMC management chips, allowing hardware monitoring and management to be separated from the production business network.
Out-of-band monitoring does not consume CPU or memory resources, separates hardware monitoring from the operating system, and supports remote physical restart and hardware log collection. For enterprise users, that is a stronger value proposition than simply showing a temperature number.
A normal CPU temperature monitor tells you what is happening when the machine is reachable. Sensaka helps teams keep hardware visibility even when the operating system or business network is unstable.
Best Practices for Monitoring CPU Temperature in Data Centers
Sensaka vs Basic CPU Temperature Monitor Tools
| Capability | Basic Monitor | Sensaka |
|---|---|---|
| Shows CPU temperature | ||
| Shows fan speed and voltage | Often yes | |
| Monitors one PC or workstation | Not the main focus | |
| Monitors multi-vendor data center hardware | Limited | |
| Works across server, storage, network, power environment | Limited | |
| Maps hardware risk to business service | No | |
| Supports out-of-band hardware visibility | Usually no | |
| Supports asset, rack, and lifecycle context | No | |
| Supports ITSM and operational workflows | Limited |
When a Basic CPU Temperature Monitor Is Enough
A lightweight CPU temperature monitor is enough when you are checking a personal PC, gaming workstation, test machine, or single server. Tools like Open Hardware Monitor and HWMonitor are useful for reading local hardware sensors and troubleshooting individual devices.
Sensaka becomes relevant when the environment includes many servers, racks, vendors, business services, and operations teams. The value is not just reading the CPU temperature. The value is knowing where the risk is, what it affects, and how to act before users feel the impact.