
Seeing One AI Training Job End to End: Resources, Power, Thermal and Health
When a long training run slows down, the scheduler, the hardware team, the network team and the storage team each look at their own screen. The answer is usually in the gap between them.
A training job is the unit that matters to the people paying for an AI factory. It is also the unit that most monitoring tools cannot see. Hardware monitoring sees cards and nodes. The scheduler sees jobs and queues. Network and storage tools see links and volumes. Facilities sees racks and coolant. When the job slows, each team can show that its own layer looks normal, and the run keeps losing hours.
This post follows one training job through every layer it touches and sets out what an end-to-end view needs: the mapping from job to hardware, one timeline for compute, network and storage, power and thermal data next to the job, and the signals that protect a long run before it fails.
What one job touches
A distributed training run is a set of containers on several nodes, each bound to a number of GPUs. The GPUs talk to each other over the cluster network, read training data from shared storage, and write checkpoints back to it. The nodes sit in racks with their own power feeds and, on dense AI hardware, their own liquid cooling loop.
Any of these layers can slow the job. A GPU throttling on temperature drags every other GPU in a synchronized run down to its speed. A congested link stretches each communication step. A storage system that cannot keep up leaves every GPU waiting at the start of each batch. None of these show up as a failure, so none of them raise the alarm that a crashed node would.
Map the job to the hardware
The first requirement is a live mapping from job to containers, nodes and GPUs. Without it, a hardware alert is just an alert, and nobody can say which run it affects. With it, a card's ECC errors become "the run for project X, on node 17, card 3".
Sensaka for AI Data Centers keeps this mapping as part of its AI workload operations. Operators can see which containers use a given GPU and which cards are assigned to a given container. The platform also tracks requested GPU memory, resource limits and actual peak use, and records each GPU binding and release event, which matters later for incident review, audit and capacity planning. The same relationships sit in the AI infrastructure CMDB, so impact analysis can walk from a failing card up to the job, project and tenant.
When the job slows: compute, network or storage?
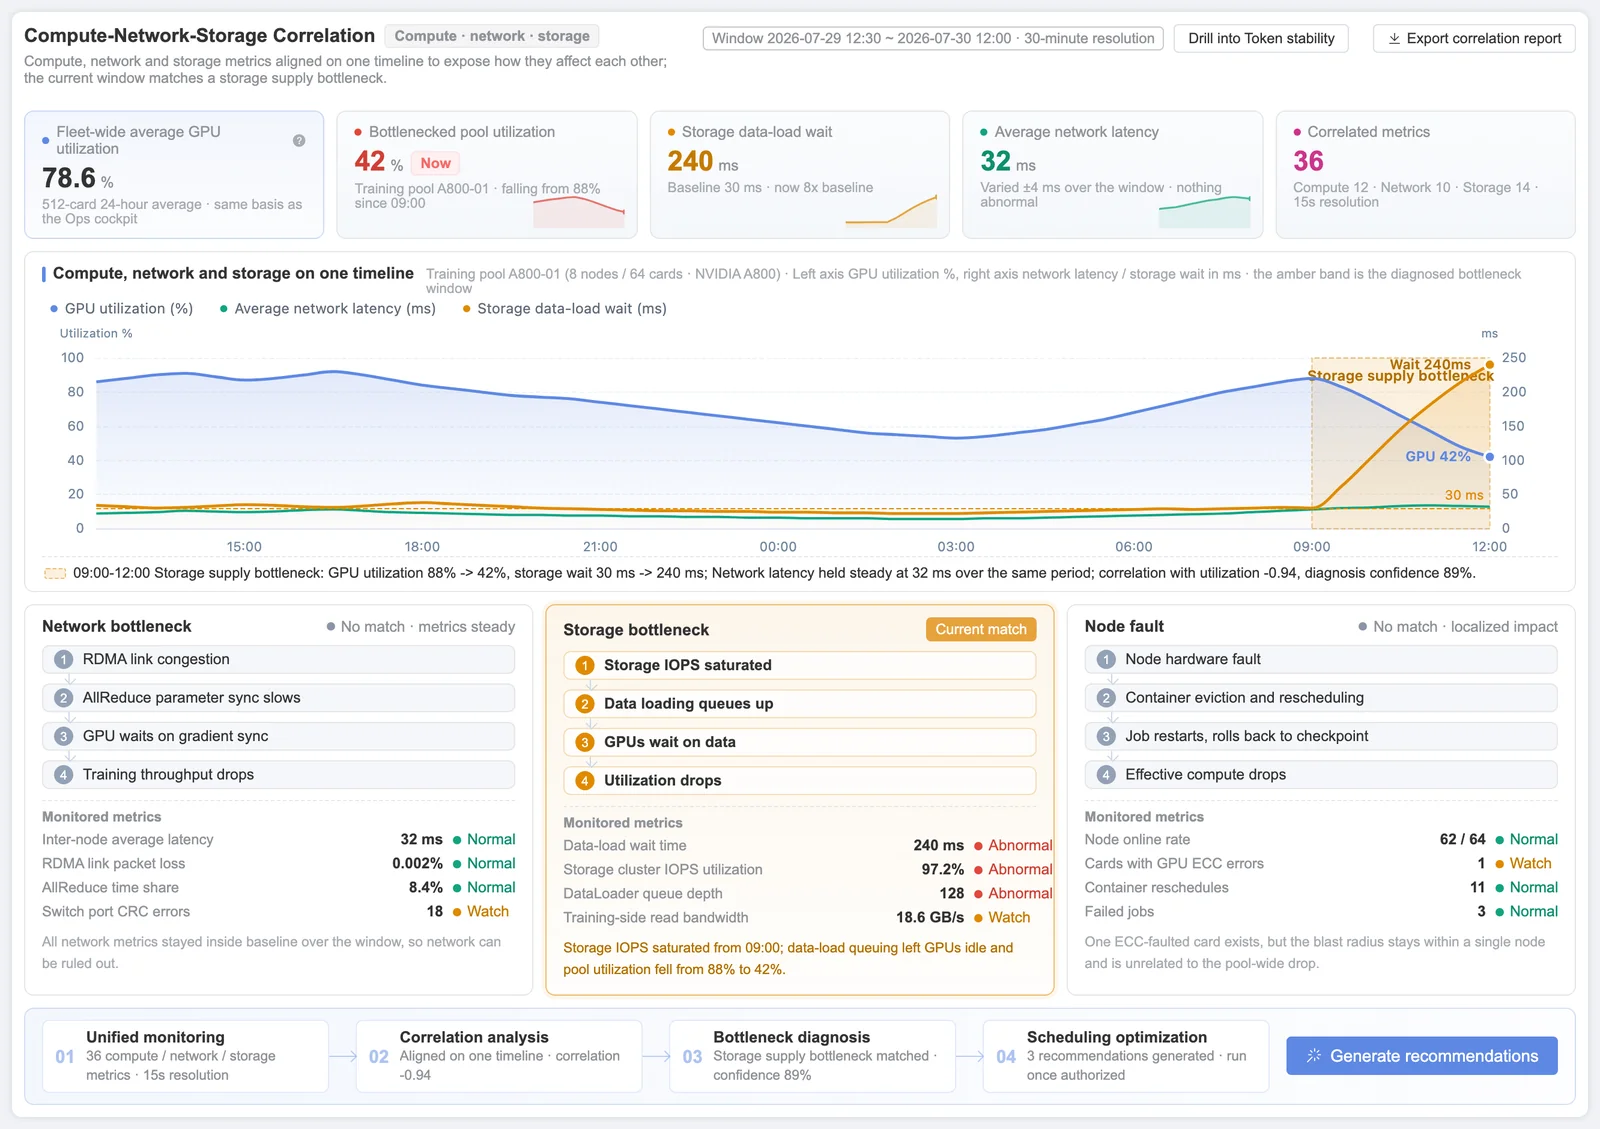
Low GPU utilization on a running job does not mean the job needs fewer GPUs. More often the GPUs are waiting for something. The quickest way to find out what is to put GPU utilization, network throughput and latency, storage throughput, IOPS and read and write latency, and node health on the same time axis for the same job.
Read that way, the pattern is usually plain. If GPU utilization drops at the same moments storage throughput hits its ceiling, the job is data-starved. If utilization dips in step with spikes in network latency, communication is the bottleneck. If one node's GPUs run hotter and slower than the rest, the problem is local hardware. Sensaka draws these curves together, highlights the window where they move together and marks the side that looks like the bottleneck, with a cause chain from symptom to root cause and a suggested action.
For training efficiency over time, teams also track model FLOPs utilization (MFU), which compares the work a run actually does with what the hardware could deliver. MFU is calculated from the model and the step time, so it complements the infrastructure view rather than replacing it.
Power and thermal belong in the job view
Power and temperature are usually treated as facility data, read by a different team on a different screen. On dense GPU racks they are job data. A card that reaches its thermal limit slows down. A rack running close to its power limit leaves no headroom for the load swings that training produces. A cooling loop with falling flow on one branch affects exactly the servers on that branch.
Sensaka reads card-level temperature and power with the job mapping, and correlates them with rack power density, inlet temperature and, where racks are liquid cooled, coolant temperatures, pressure difference and leak detection from liquid cooling monitoring. Energy can be attributed by project, so the cost of a run includes the power it drew, and power drawn by GPUs that were allocated but not busy shows up against the project that held them.
Protecting long runs before they fail
A long training run that fails goes back to its last checkpoint, and without one it starts again. The industry practice for protecting runs has four parts: detect degrading hardware early, checkpoint often enough, isolate a failing card or node, and resume from the latest checkpoint on healthy hardware.
The operations platform's part is the evidence. Sensaka watches ECC and temperature trends to flag cards that are degrading before they fail, shows checkpoint cadence, where each checkpoint was written and how long the write took, and quantifies the training time lost when a run has to go back. Isolation recommendations come with the job context, and a person confirms when to isolate, so a card is not pulled in the middle of a checkpoint write. Restart and resume themselves are handled by the training framework and the scheduler.
The questions a good job view answers are short. Which hardware is this job on right now? Is it slower than yesterday, and which layer moved first? How old is its last checkpoint, and how long did it take to write? Which cards under it show warning signs? If those take one screen instead of four teams, the view is doing its job.
Frequently asked questions
Why is GPU utilization low on a training job that has all the GPUs it asked for?
Usually because the GPUs are waiting: on data from storage, on communication between nodes, or on one slow or throttling card that holds back a synchronized run. Putting GPU, network and storage metrics on one timeline for the job shows which.
What is GPU and container correlation?
It is the live mapping between workloads, containers, GPUs, nodes and resource pools. It shows which containers use a given GPU and which GPUs a container holds, together with requested and peak GPU memory and the history of binding and release events.
How do you reduce lost training time?
Detect degrading hardware before it fails, checkpoint at a cadence that matches the cost of lost work, isolate failing hardware with the job context in view, and resume from the latest checkpoint. Measuring checkpoint write time and lost training time shows whether the cadence is right.
The AI workload operations page covers jobs, queues and training fault tolerance, and AI infrastructure observability covers the hardware and correlation side. Both are part of the Sensaka for AI Data Centers. To follow your own training jobs end to end in your AI factory, start a free 30-day on-premises pilot, check list prices on the pricing page, or ask about the partner programme, which pays resellers a 25% margin in year one.
Follow a training job from its containers down to the rack it runs in. Start a free 30-day pilot on your own hardware, inside your network.
Start a Pilot →Sensaka for AI Data Centers
GPU pools, workload queues, GPU-hour and token metering, and an operations cockpit with an AI Cockpit, on one on-premises platform.
Related articles & analysis