
Stranded GPU Capacity: Why Installed GPUs and GPU Utilization Reports Disagree
Procurement, facilities and the platform team can each give a different GPU count for the same cluster, and all of them can be right. The number that matters is how many GPUs are usable today, and how many of those are doing work.
Ask how many GPUs an AI data center has and you can get several honest answers in the same meeting. Procurement counts what was bought. Facilities counts what is racked and drawing power. The platform team counts what the scheduler can hand out. The people paying for the AI factory want to know how many of those cards did useful work last week, and that is usually the hardest figure to find.
The difference between those numbers is stranded GPU capacity: accelerators that are paid for and installed but cannot be used, or are held by work that leaves them waiting. This post explains why the counts drift apart, which states a GPU passes through between the loading dock and a running job, why allocation and GPU utilization are different measurements, and how an operations platform keeps the usable number current.
Every team is counting something real
The disagreement is rarely about someone being wrong. Each team counts a different thing, and each count is correct for its own purpose.
- Procurement and finance count purchase orders and asset records. A card exists from the day it is paid for.
- Facilities counts installed servers in powered racks, because that is what draws power and needs cooling.
- Infrastructure operations counts nodes that boot, pass health checks and report into monitoring.
- The platform team counts nodes that have joined a cluster, sit in a GPU pool and are allowed to take work.
- The business side counts GPU-hours that ended up in completed training runs or in tokens served to users.
When these figures sit in five spreadsheets, a gap between installed and usable looks like a reporting error. Usually it is an operating fact. Some cards are waiting for something, and nobody has a single view of what they are waiting for.
The states a GPU passes through
It helps to name the states. A GPU that was bought is not yet installed. An installed GPU may not be healthy. A healthy GPU may not yet be provisioned into a cluster. A provisioned GPU can be held out of the pool for maintenance. A pooled GPU can be allocated to a job that leaves it idle for long stretches. Each transition has its own owner and its own reasons to stall, and every stall adds to stranded GPU capacity.
The sequence also explains why a capacity figure needs a definition and a date. "We have this many GPUs" means little until it says which state it counts and when the count was taken.
Where stranded GPU capacity hides
Between installed and healthy. New servers arrive with firmware that does not match the cluster baseline, and some cards fail their first load test. Older nodes develop faults that do not stop them outright: a card that throttles on temperature, a fan running at its limit, correctable memory errors that keep rising. A node in that condition is still counted as installed, and sometimes as available, until a job fails on it.
Between healthy and in the pool. Bare-metal setup is a chain of steps: management controller configuration, operating system install, drivers and runtime, then joining the cluster. When any step needs a person, racked servers can wait days for someone to finish it, and they look like capacity the whole time.
Between pooled and allocated. Jobs request a fixed shape of resources. When free GPUs are scattered across nodes in pieces that no queued job can use, the pool shows free capacity while the queue keeps waiting. Quotas can have the same effect: one team's unused quota is capacity another team cannot reach.
Allocation is not GPU utilization
The last gap is the most expensive one. A training job can hold eight GPUs and keep them waiting on storage or on the network. The scheduler reports full allocation and the cards report low GPU utilization. Both are true. Allocation says a job owns the card; utilization says whether the card is computing.
Even GPU utilization needs care. The common utilization counter reports the share of time a kernel was running, which can read high while much of the chip sits unused. Teams that care about training efficiency also look at how many streaming multiprocessors were active and at model FLOPs utilization (MFU), which compares the work actually done with what the hardware could do. For a capacity report the practical rule is simpler: show allocation and utilization side by side, per pool and per project, and treat a large gap between them as stranded capacity with a cause to find.
Making the usable number a daily figure
The fix is to keep every state in one record that updates itself, so the count becomes a query instead of a project. That is the job an AI data center operations platform takes on, and it is how the Sensaka for AI Data Centers approaches it.
Inventory comes first. The AI infrastructure CMDB holds each accelerator with its model, the node it sits in, its rack and site, its operational status and the pool or job it is assigned to. Because those relationships are kept live, the same record answers "how many are installed" and "how many are allocated" without a reconciliation step in between.
Health comes from the hardware itself. Sensaka reads card-level utilization, temperature, power and health, and collects hardware state out-of-band through each server's BMC, so a node with a failing card is visible even when its operating system has stopped reporting. Abnormal accelerators are flagged with isolation recommendations, which takes them out of the usable count on purpose rather than by accident. The AI infrastructure observability page covers the detection side.
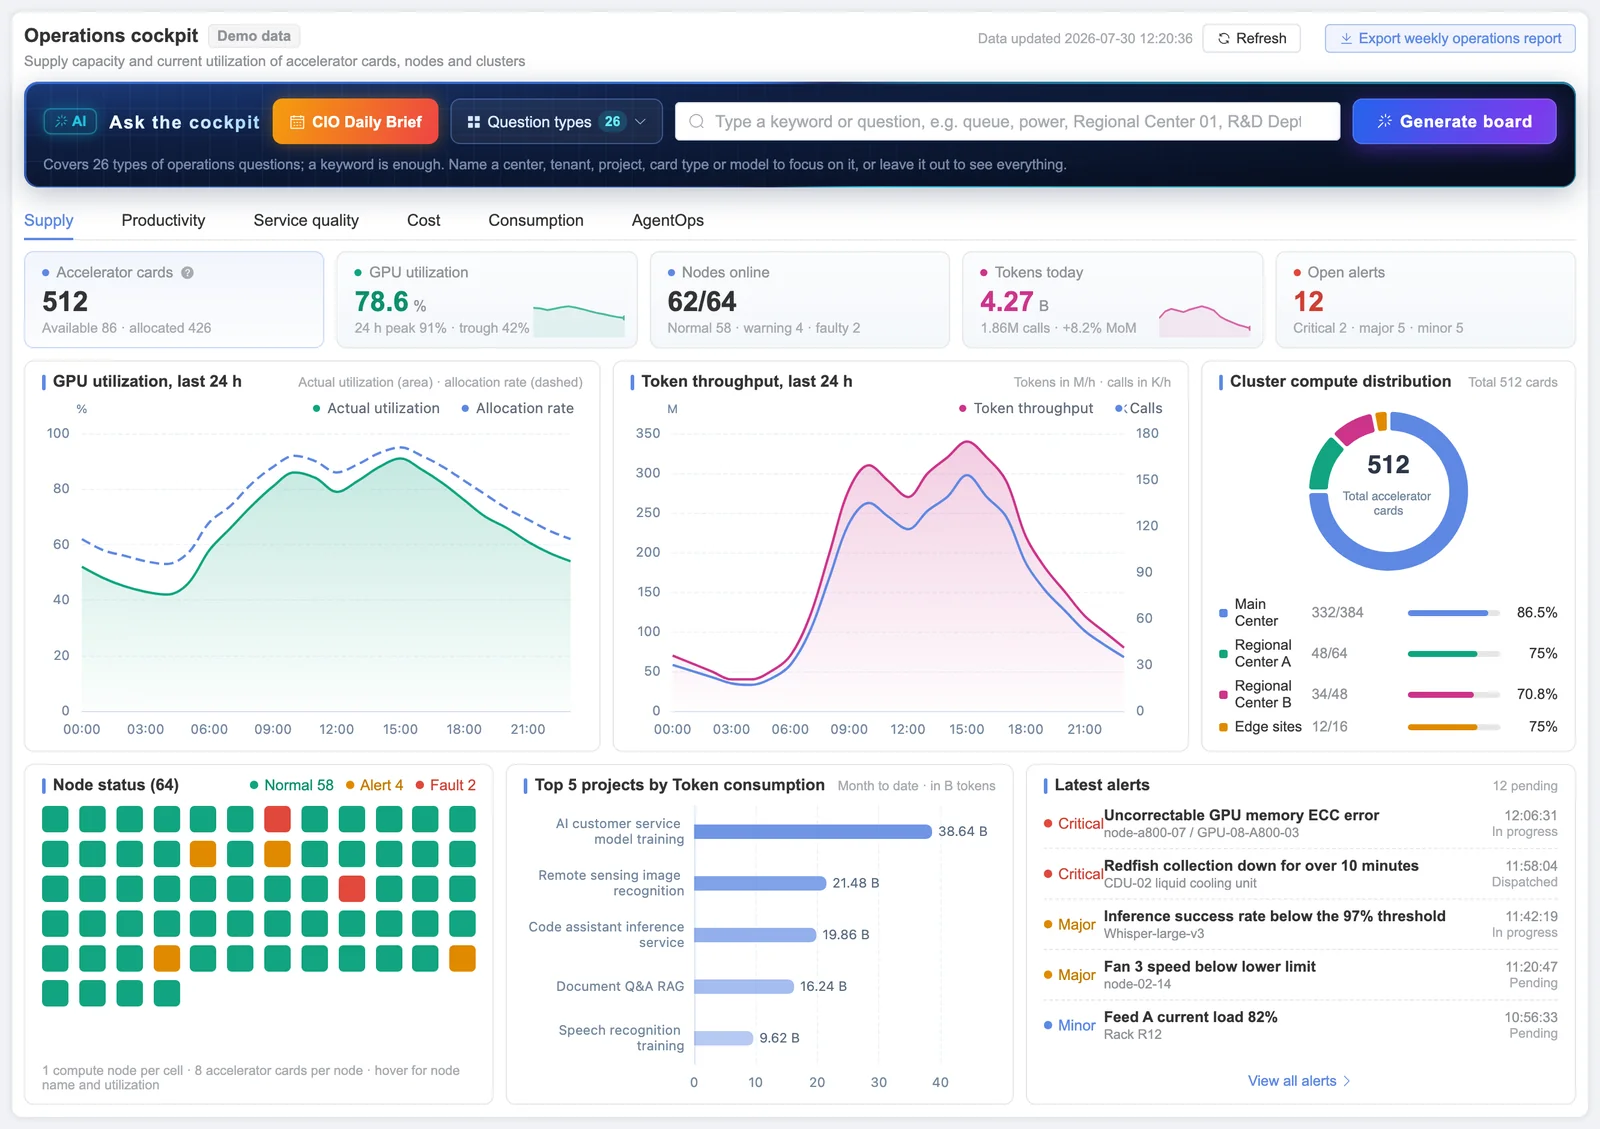
Provisioning is automated so the step from healthy to pooled does not wait for people: BMC initialization and power control, PXE installation, driver and runtime setup, then the node joins its cluster. GPU pool operations describes how pooled capacity is then issued through standard specs, queues and quotas. Finally, GPU usage metering records GPU-hours and idle capacity by project, tenant, model and accelerator type, and the operations cockpit shows supply (cards, available cards, nodes online) next to efficiency (GPU utilization, running and queued jobs) on one screen.
What to report upward
A capacity report that survives questions shows the funnel, not a single number. For each period, state how many GPUs were installed, how many were healthy, how many were in pools, how many were allocated on average, their average GPU utilization and how many GPU-hours went to completed work. Then list the reasons behind the largest gap with an owner against each: a firmware baseline to roll out, a batch of nodes waiting for provisioning, fragmentation in one pool, a training job stalled on storage.
This also changes the expansion conversation. If much of the installed capacity is stranded before the pool, buying more cards adds to the stranded share. If the pools are full and the queues are long, expansion has a case. The same data supports either answer, which is the reason to keep it in one place.
Frequently asked questions
What is stranded GPU capacity?
Stranded GPU capacity is accelerator capacity that has been bought and installed but cannot do useful work: cards with hardware faults, nodes still waiting for provisioning, free GPUs fragmented across nodes, quota nobody uses, and allocated GPUs left waiting on data or the network.
Why can GPU utilization be low when every GPU is allocated?
Allocation means a job holds the GPU. GPU utilization measures whether the GPU is computing. A job that waits on data loading, storage throughput or network communication can hold its GPUs at low utilization, so the two figures have to be read together.
How often should AI capacity figures be reconciled?
When inventory, hardware health and scheduler data live in separate tools, reconciliation tends to happen once per reporting cycle, by hand. When the states are kept in one live record, the usable count can be read at any time and the report only has to explain the gaps.
If your capacity reports disagree, start with the funnel for one cluster in your AI factory. The Sensaka for AI Data Centers page describes the whole platform, and the GPU pool operations, AI infrastructure CMDB and GPU usage metering pages cover the pieces discussed here. You can run it on your own hardware in a free 30-day on-premises pilot and check list prices on the pricing page. Integrators who want to resell it can join the partner programme, which pays a 25% margin in the first year.
See installed, healthy, pooled and allocated GPUs, and their utilization, in one record. Start a free 30-day pilot on your own hardware, inside your own network.
Start a Pilot →Sensaka for AI Data Centers
GPU pools, workload queues, GPU-hour and token metering, and an operations cockpit with an AI Cockpit, on one on-premises platform.
Related articles & analysis