
AI Data Center Cooling and Power: Why They Are AI Operations Signals
In a traditional data center, power and cooling were the facilities team's problem and a server alarm was the IT team's. On dense GPU racks a drop in coolant flow and a slow training job can be the same event.
For most of the history of the data center, facility data and IT data lived apart. The building management system watched chillers, power distribution and room temperature. The IT team watched servers. The two met when something went badly wrong, and the split worked because air-cooled racks had headroom: a cooling problem took a while to reach the chips.
An AI factory removes most of that headroom. This post explains how power density changes AI data center cooling and power, which facility signals now belong in the AI operations view, and how to connect a cooling alarm to the jobs and tenants it affects.
Why facility data used to sit apart
The old split had good reasons. Facilities equipment speaks its own protocols, belongs to a different budget and is maintained by different people. Most alarms from it were slow-moving: a chiller running warm, a UPS on battery test, a humidity reading drifting. The IT side rarely needed them in real time, and the facilities side rarely needed to know which application ran in which rack.
The result is a gap in the middle. The facilities team can tell you the cooling loop is within its limits. The IT team can tell you the training job is slower than yesterday. Nobody is asked to say whether those two facts are related.
How power density impacts AI data center cooling
GPU servers concentrate far more power in a rack than general-purpose servers, and nearly all of that power becomes heat in a small space. Air cooling runs out of room as density rises, which is why dense AI racks increasingly use liquid cooling, with coolant distribution units (CDUs) feeding branches that run to cold plates on the chips. Our guide to the liquid-cooled data center covers the hardware side.
Density changes the operating picture in three ways. Margins shrink, so a small change in coolant flow or temperature reaches the chips quickly. Load moves fast, because training alternates between heavy compute and communication, and power draw swings with it; our case study on GPUs dropping off the bus after power spikes shows what that can do. And failures become partial: one branch of a loop or one power feed affects a specific set of servers, which means a specific set of jobs.
The middle of that chain is the dangerous part. A GPU that reaches its thermal limit lowers its clocks instead of failing. Nothing crashes and no alarm fires, but in a synchronized training run every other GPU waits for the slowest one.
Cooling and power signals for the AI operations view
The facility signals worth bringing into AI operations are the ones that can change job behavior within minutes or hours:
- Rack power density, as a heat map with warnings when a rack or zone approaches its limit.
- Card-level temperature and power, read from the GPUs and, out-of-band, from each server's BMC.
- Liquid cooling status: CDU state, flow on each branch, supply and return temperatures, pressure difference and leak detection.
- Efficiency by zone: PUE and WUE in real time and as trends, with liquid-cooled and air-cooled zones compared.
- Energy against output: energy per project and per token, and the power drawn by GPUs that were allocated but idle.
Sensaka for AI Data Centers collects these alongside the IT data, and liquid cooling monitoring covers the loop in detail. Liquid cooling support in Sensaka is monitoring: the platform reads and correlates the loop's data and raises alarms, and control of pumps and valves stays with the cooling system's own controllers.
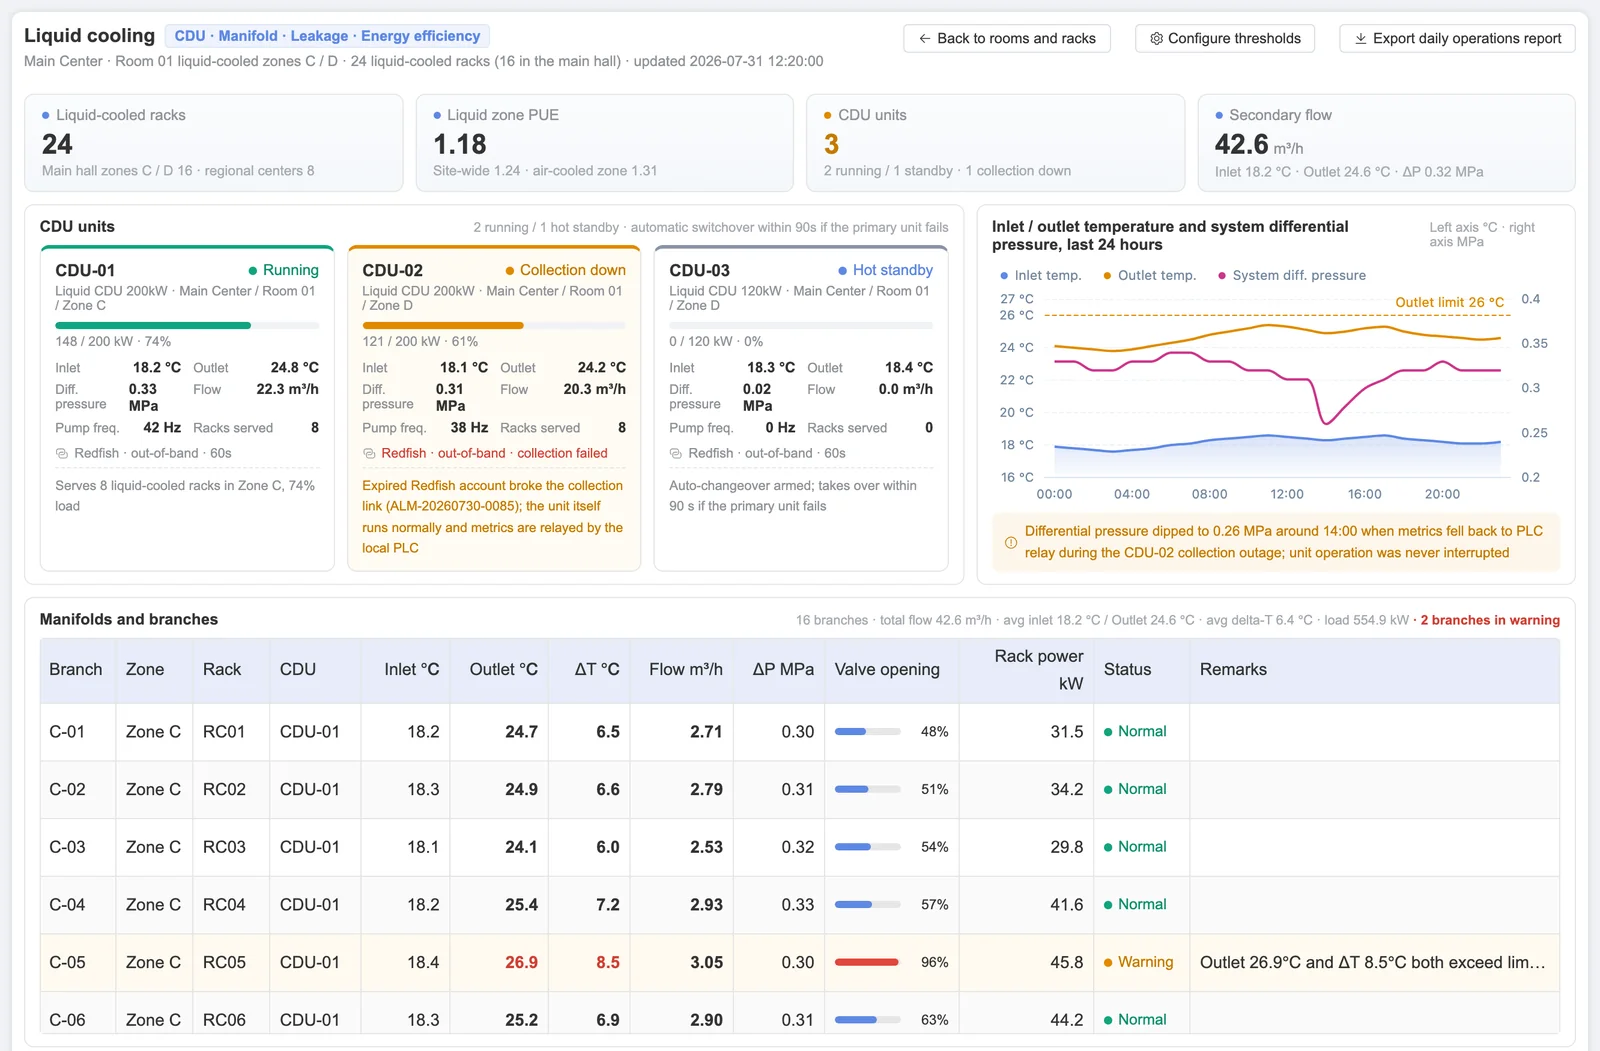
From cooling alarm to affected jobs
A cooling alarm becomes useful to AI operations when it carries its consequences. That requires relationships: which branch feeds which racks, which servers sit in those racks, which GPUs are in those servers, and which jobs and tenants are running on them right now. The AI infrastructure CMDB holds those relationships, so a flow warning on one branch can be read as a list of affected nodes, jobs and tenants rather than a line in the facilities log.
The same path works in reverse. When a job slows, the operator can check whether the cards under it run hotter than their neighbors, whether their rack is close to its power limit, and whether their cooling branch shows a flow or temperature change at the same time. The AI infrastructure observability page describes how these readings are correlated with GPU, network and storage data.
Where to start
Start with the racks that carry the most expensive work. Map each one to its power feed and cooling branch in the CMDB, so every facility reading has a place in the relationship model. Then put rack power, card temperature and coolant readings for those racks on the same screen as the jobs running there, and agree the thresholds with both the facilities and the AI operations team.
Finally, review one month of slow or failed jobs against the facility data for the same period. If some of them line up with cooling or power events, the case for running AI data center cooling and power as operations signals makes itself, and the review gives both teams a shared list of fixes.
Energy as an operating number
Power is also a cost line, and in an AI factory a large one. Treating it as an operating number means measuring energy per project and per token next to GPU-hours, so cost per token reflects the power actually drawn. It also means ranking the power used by GPUs that were allocated but not busy, by project, so idle capacity has a cost the owner can see. GPU usage metering carries these figures into project and tenant reports.
In the EU the same data feeds sustainability reporting. Our overview of EED data center reporting and the EU EED glossary entry explain what operators above the reporting threshold have to submit.
Frequently asked questions
How does power density impact AI data center cooling?
Higher rack power density puts more heat in less space, so air cooling runs out of headroom and dense GPU racks move to liquid cooling. Margins shrink, load swings faster, and a change on one cooling branch reaches the chips on that branch quickly, often as thermal throttling rather than a failure.
Why should AI operations teams watch cooling and power data?
Because on dense GPU racks a cooling or power problem often shows up first as a slower job, not an alarm. Seeing rack power, card temperature and coolant data next to job data lets the team connect a slow training run to its physical cause.
Does liquid cooling monitoring control the cooling system?
In Sensaka, no. Liquid cooling monitoring reads CDU status, branch flow, temperatures, pressure difference and leak detection, correlates them with rack and GPU data and raises alarms. Pumps and valves stay under the cooling system's own controls.
To bring AI data center cooling and power into the same view as your GPUs and jobs, see liquid cooling monitoring, AI infrastructure observability and the Sensaka for AI Data Centers overview. A free 30-day on-premises pilot runs on your own hardware, list prices are on the pricing page, and integrators can resell the platform through the partner programme with a 25% margin in the first year.
See rack power, coolant data and GPU temperatures next to the jobs they affect. Start a free 30-day pilot on your own hardware, inside your network.
Start a Pilot →Sensaka for AI Data Centers
GPU pools, workload queues, GPU-hour and token metering, and an operations cockpit with an AI Cockpit, on one on-premises platform.
Related articles & analysis